Live geography intelligence · state to city

Know what your district is thinking, before it shows up in polling.

Undercurrent reads what every state, congressional district, county, and city is paying attention to, updated continuously. Not a poll, not a projection. Actual signal.

Read how we're different

hello@undercurrentdata.com

TOPIC INTELLIGENCE MAP · ALL DISTRICTS  LIVE · UPDATED 2H AGO
TX-07 Houston Metro
Economy
82%
Healthcare
67%
Immigration
54%
Positive
41%
Negative
38%
TOPIC INTENSITY LOW
HIGH
All Districts Covered
15M+ Daily Signals
Live Signal Feed

A different kind of signal

We track what people read.
Not what they say.

Most political intelligence tools watch social platforms: posts, shares, comments on X, Facebook, TruthSocial. That's performative data. People post for an audience.

Undercurrent watches actual content consumption across the open web. It's not curated for a public feed. What someone quietly reads at 11pm is a truer signal than what they broadcast at noon, and it covers the people who consume but never post (which is most of them).

The signal your competitors are reading is the one people chose to show. Ours is the one they didn't.

Platform Capabilities

See what's moving. Understand why. Know who to reach.

Pollsters and public affairs teams use Undercurrent to answer the questions their current tools can't: what's moving in a district, county, or city right now, why it's moving, who's paying attention, and how to reach them.

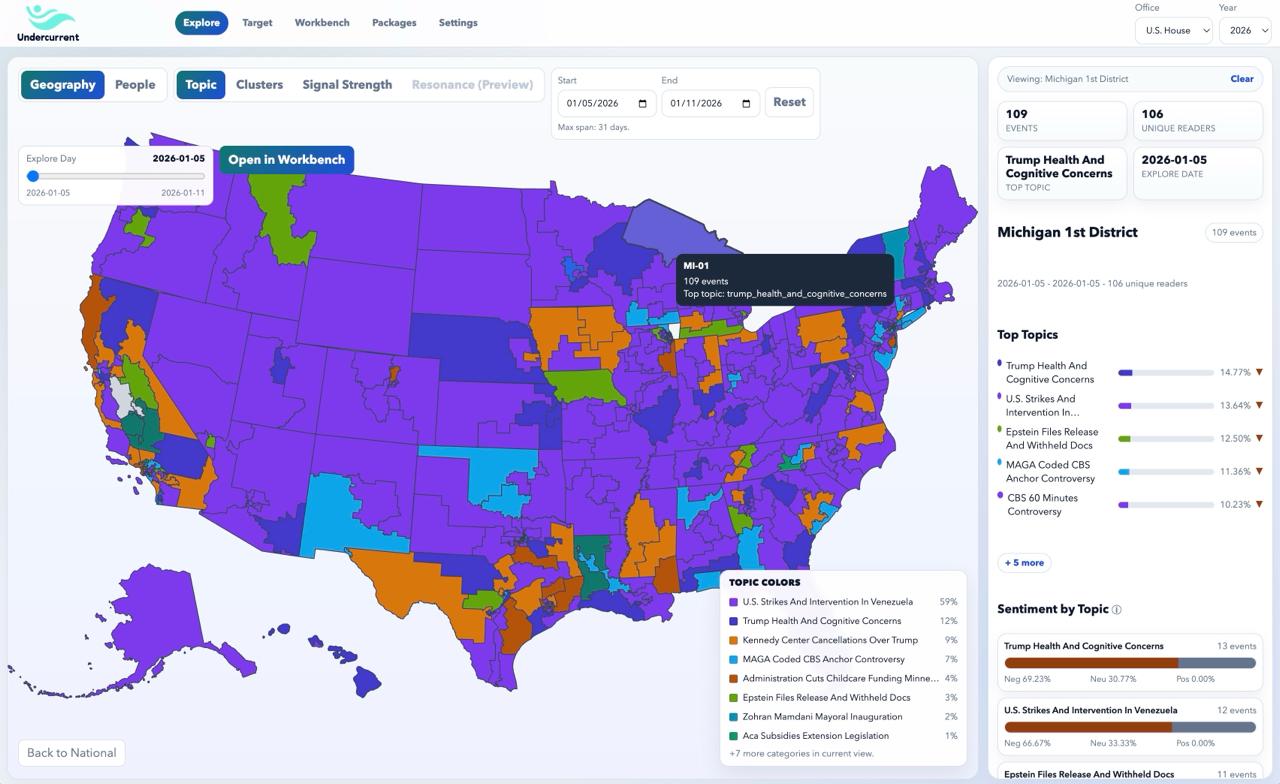
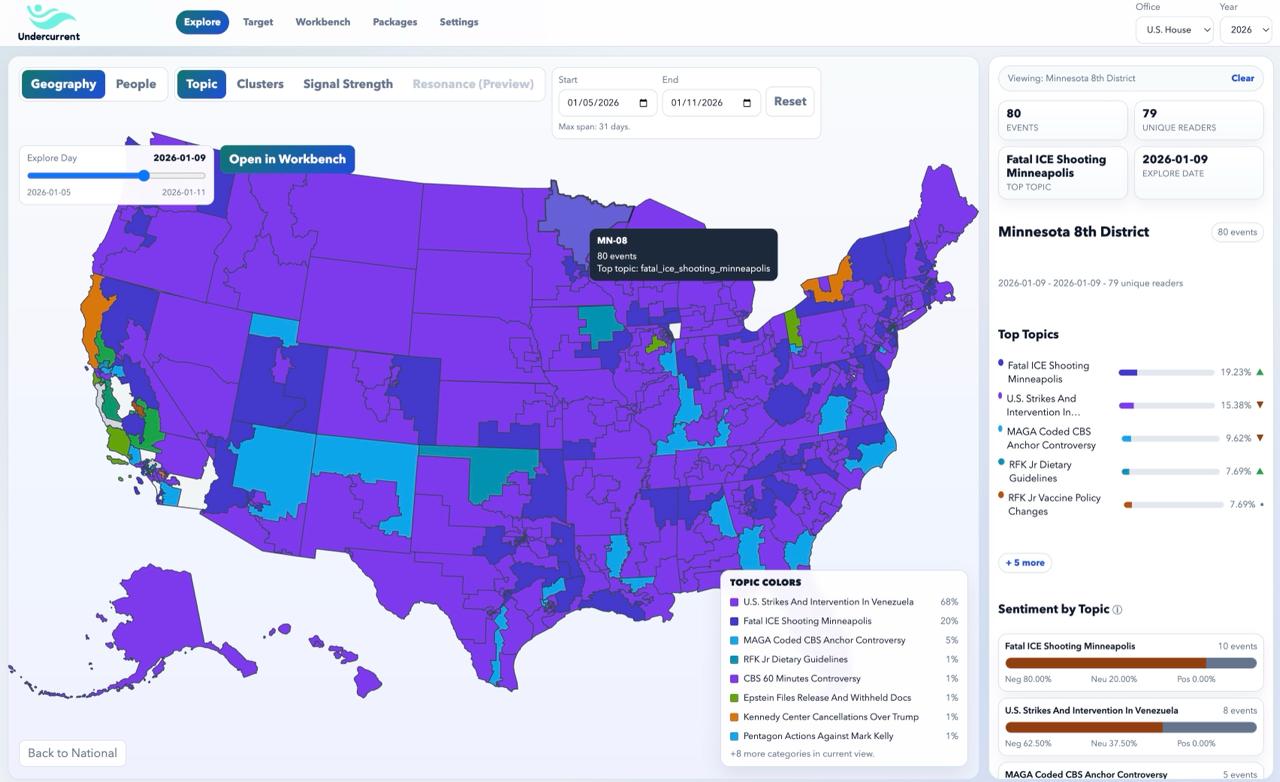
Geography. Move from a national view down to a single city — through state, congressional district, or county — and see what's leading the conversation, what's fading, and what just started moving at every level.
Geography view: district topic intelligence map
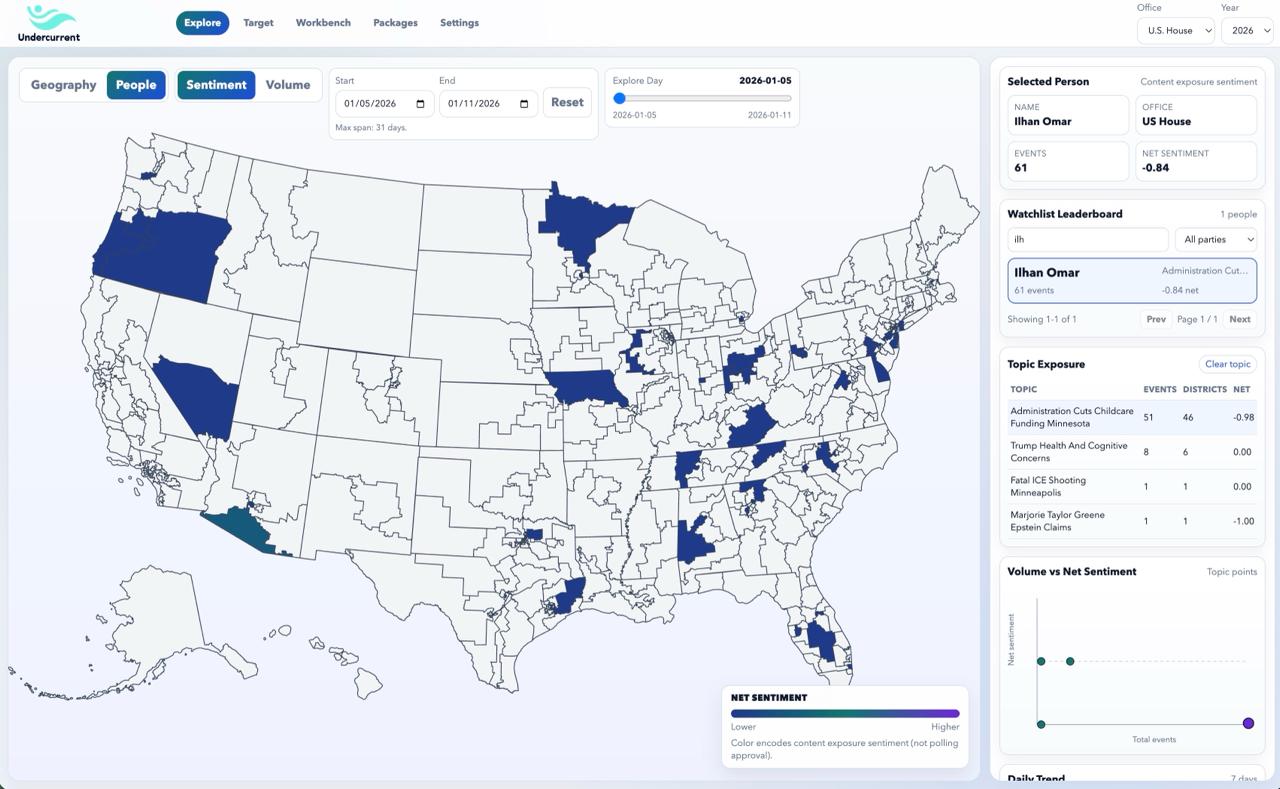
People. Track politicians and public figures across every district, county, and city. See net sentiment, topic exposure, and volume trends. Know who's gaining traction where, and when someone starts moving in territory that matters to you.
People view: politician tracking across districts
Topic. Pick any issue and see exactly where it's resonating, where it's fading, and how sentiment is breaking down by district. Date-sliceable, so you can track narrative velocity over time.
Topic view: national choropleth with district drill-down
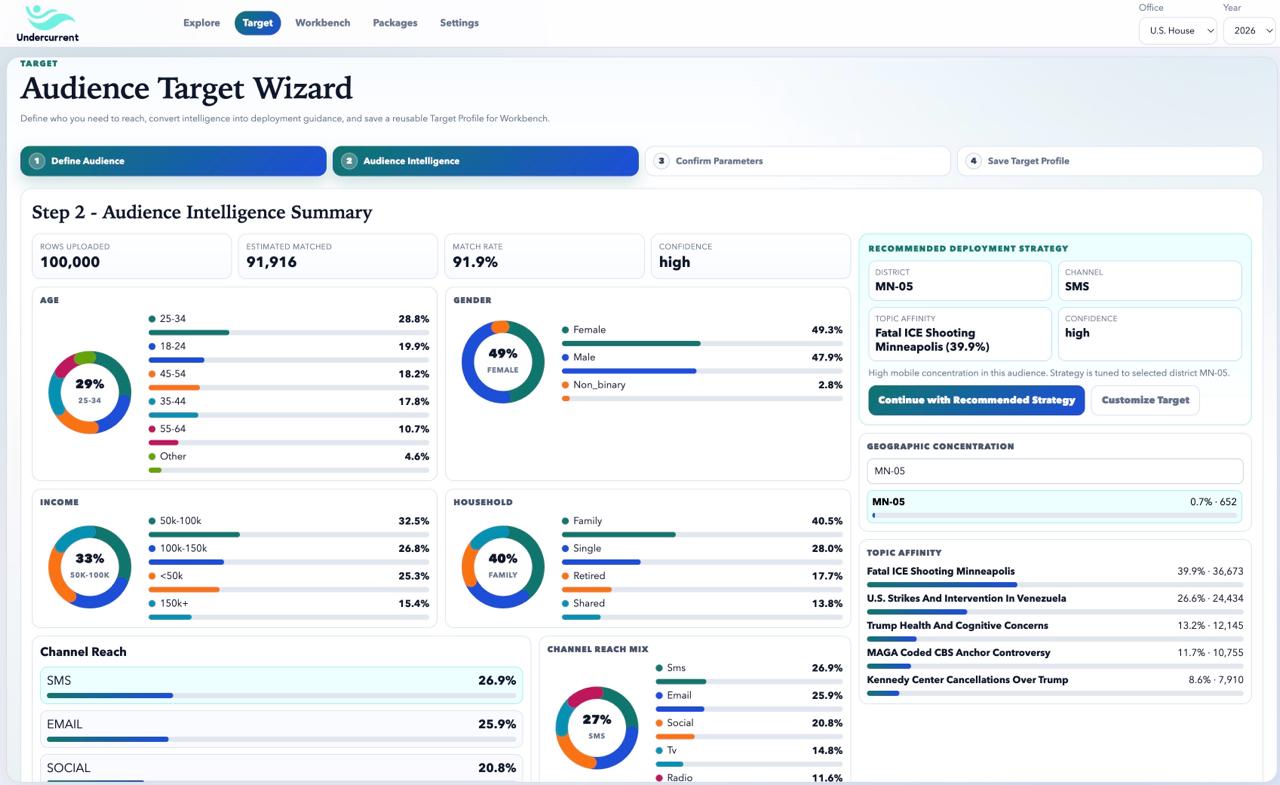
Target Audience. Upload a voter file, donor list, or event attendees. Get match rates, demographic profiles, topic affinity scores, and a recommended channel strategy (SMS, email, social, CTV) before you spend a dollar.
Target Audience view: audience matching and channel strategy

Who Uses Undercurrent

Built for the teams that shape political outcomes

Campaigns

Know what your district is thinking before your opponent does.

Continuous signal on issues, sentiment, and what's gaining traction, district by district. Stop guessing what the message should be. Build strategy on what people are actually reading and reacting to.

Pollsters & Research Firms

A read on what's moving between your poll waves.

See what people are actually paying attention to, not just what they report in a survey. Catch issue movement early. Know what's shifting before your next wave date.

Public Affairs & PR

Know what's building before it makes the news.

Watch issues rise or fade across specific districts in real time. When a story starts gaining ground, you'll see it before your client's opponents do. Deliver it as something they can act on.

Digital Persuasion Agencies

Know what to say, and where to say it.

Find out which districts are soft on an issue before you start spending. Your targeting tools say who to reach. Undercurrent says what to say when you get there.

Local & Down-ballot Campaigns

District-grade intelligence for races that don't get district budgets.

Mayoral, city council, school board, state legislative. Move from your county down to a single city and see what voters there are actually paying attention to — without buying a federal-cycle research package.

Ballot Initiatives & Regional Advocacy

Track the issue, not the candidate.

Built for ballot-initiative campaigns, unions, hospital systems, and regional coalitions whose fight is local. Watch issue salience by city or county; see where to organize and where to spend; know which message is landing where.

How It Works

From raw signal to actionable intelligence

01
Signal Collection

Millions of content signals captured daily from across the web. Aggregated, anonymized, and indexed to congressional geography.

15M+ SIGNALS / DAY
02
District Attribution

Every signal is mapped through two census-anchored hierarchies — state → congressional district → city, and state → county → city — so every signal resolves to a place at the level you need.

ALL DISTRICTS
03
Topic & Sentiment Scoring

Topics are classified and sentiment is scored across an open list of issues that grows as new concerns surface — at every geography from state down to city.

TOPIC EMERGENCE
04
Intelligence Delivery

The platform reflects live signal continuously. Browse the map, drill into districts, export for briefings, or pull via API.

LIVE SIGNAL
Founding Pilot · Limited Access

Ready to see what your districts are thinking?

Request a demo and we'll run a live briefing on your districts and your issues. No decks. Just the data.

Questions? hello@undercurrentdata.com